Support Vector Machine
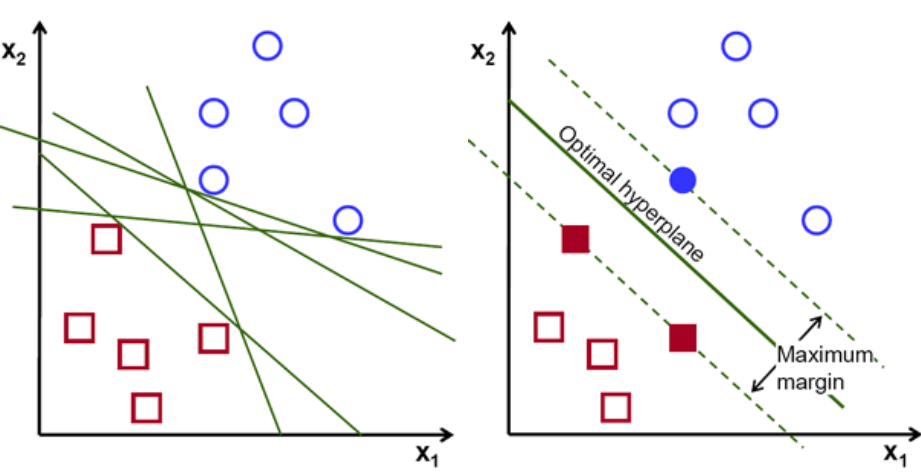
Support Vector Machine (SVM) is an algorithm that we can use to better identify a boundary to classify a data point. Instead of a singular line, the SVM algorithm finds an optimal hyperplane in an N-dimensional space (N = the number of features) that separates the data points with the largest margin possible to distinctly classify them. The example below shows a points in a 2 dimensional space with a number of linear classifiers that could potetntially separate the data (left graph), but the SVM algorithm can provide the optimal plane of separation (right graph).
After preprocessing our Titanic dataset, we trained an SVM classifier using the scikit-learn python package to classify people in the dataset on whether or not they survived the disaster. When testing this model, we received the following results:
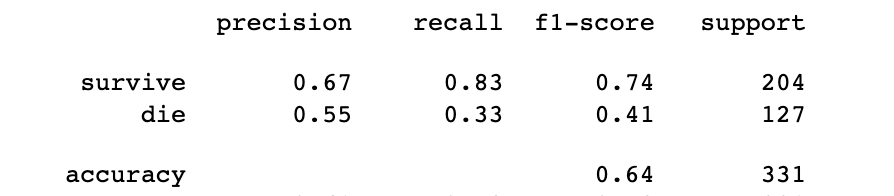
Precision is the ratio of the correctly predicted positive (or negative) observations to the total predicted positive (or negative) observations. Based on the table above, this means that 67% of the people our model predicted to survive actually did, and 55% of the people our model predicted to die actually did. Recall is the ratio of the correctly predicted positive (or negative) observations to the total number of actual positive (or negative) observations. Based on our results, this means that our model correctly classified 83% of the actual survivors in the dataset, and 33% of the people who died. The F1-Score is the harmonic average of the precision and recall scores. An F1-Score of 1 is the best score a model can get, and an F1-Score of 0 is the worst.
Overall, it appears the SVM model is much better at predicting those who would survive the disaster than who would not. The last result presented in the table above is the accuracy score of the SVM model. The accuracy score of 0.64 means that overall, our model made correct predictions of the data 64% of the time.